Here at Geolytix we’ve been working hard behind the scenes on our next exciting new product, which we’re calling ‘Interaction Surfaces’.
We’ve created a simple but powerful tool, based on mobile phone data, that allows the next level of insight into pedestrian movement patterns and trends.
What’s the point?
We often get asked questions about where our clients’ potential customers are when they’re not in their stores. Even with loyalty card data it’s hard to understand whether customers also visit competing stores. Analysing customer movement trends helps to quantify some of these previously hidden patterns, and Interaction Surfaces in GEOLYTIX MAPP puts this data at your fingertips.
Finding new opportunities
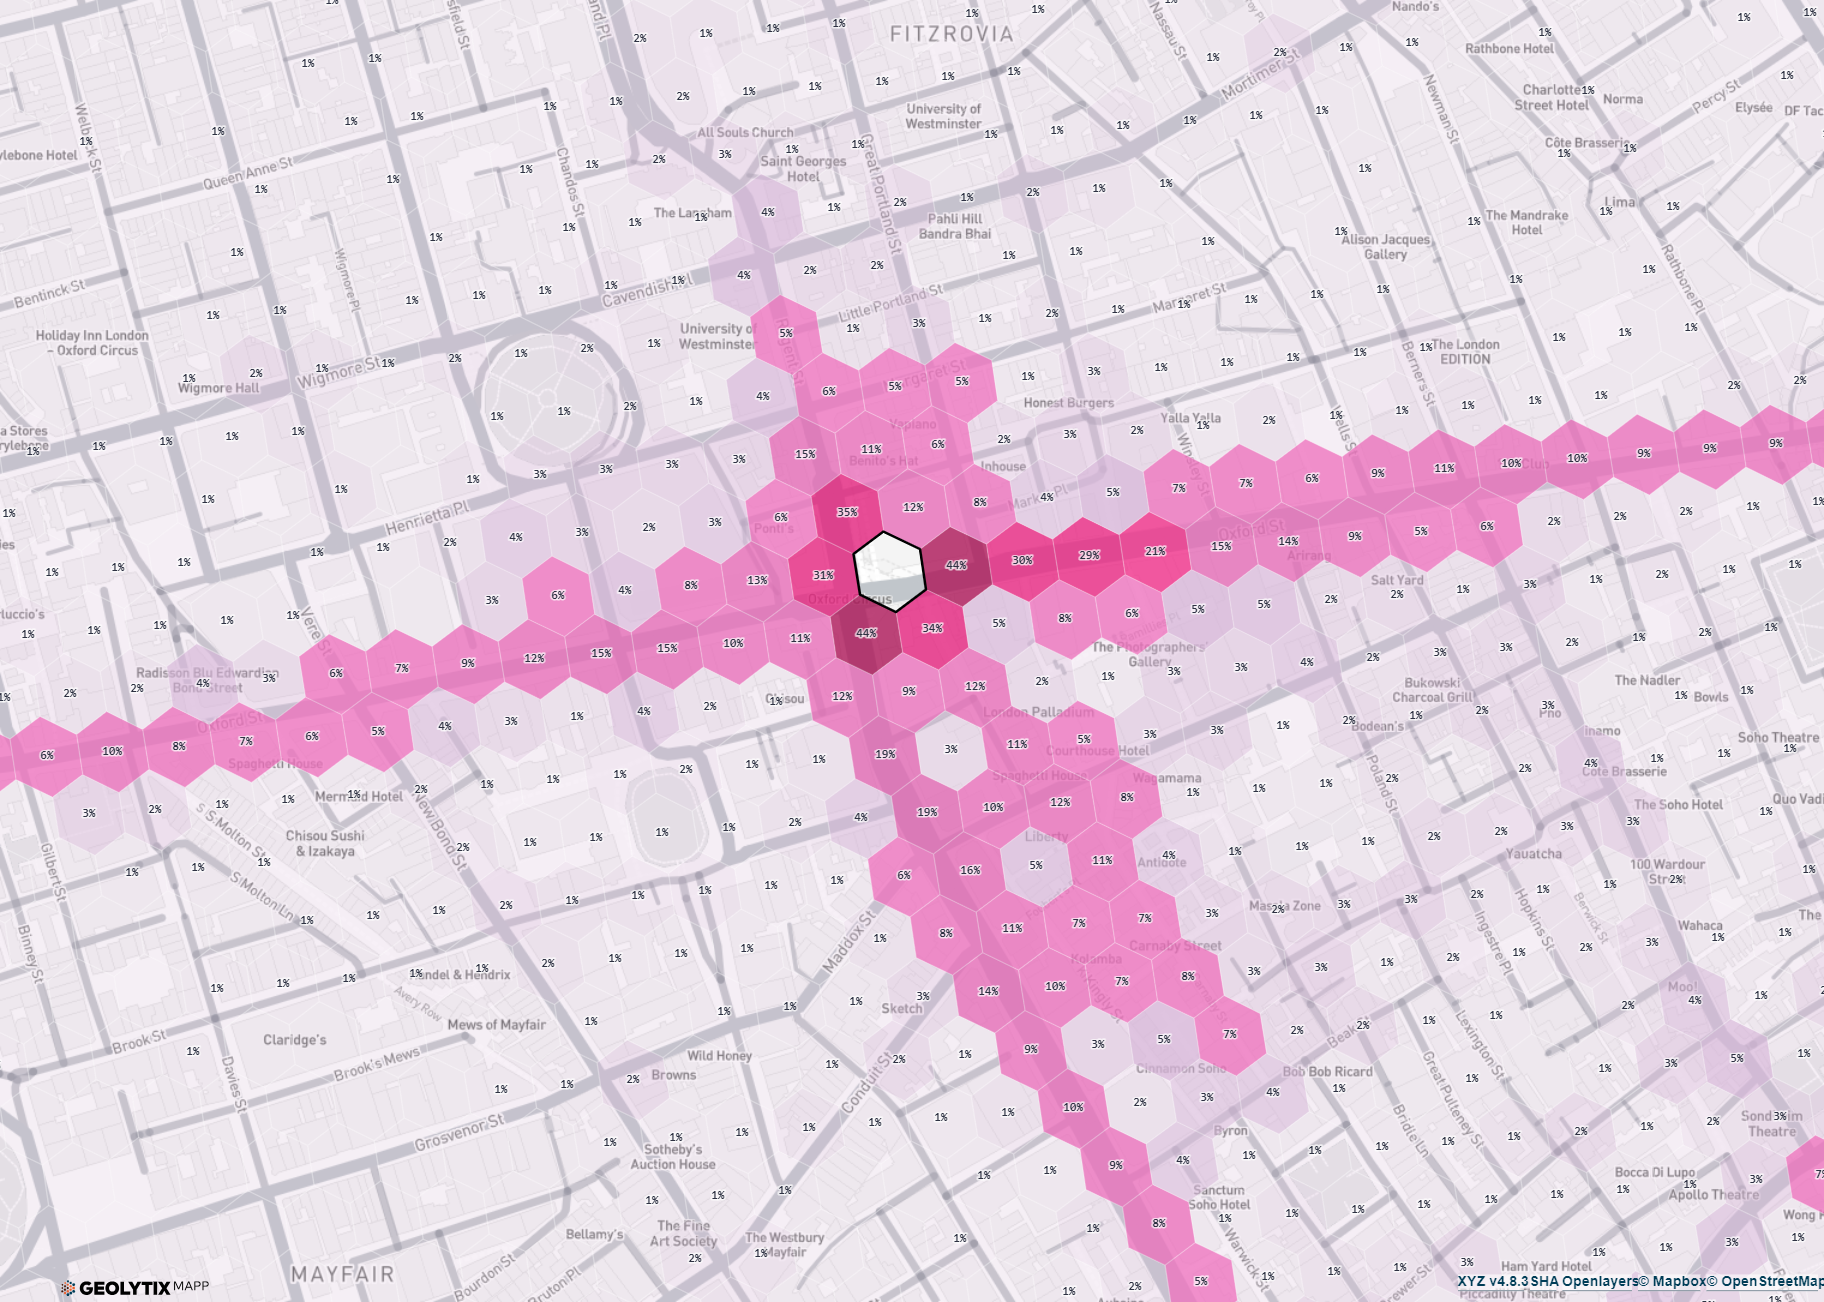
Using a measure of interaction, you can identify where in an urban area there are gaps in your store network coverage - areas where customers are who aren’t likely to have passed one of your existing outlets already.

In the example above, despite a dense store network in central London, there are some surprising ‘white spots’ where pedestrian interaction is lower than average - even very close by to existing stores.
Impact analysis
How much will a new store opening - be it a competitor or one of your own - affect sales of your existing outlets? By knowing that 20% of pedestrians will walk past their site and your outlet in the same day, you can start to assess the likely value of any impact.
How does it work?
(AKA the clever bit)
After removing vehicular mobility ‘pings’, we aggregate multiple years’ of mobility data to find patterns of ‘co-occurrence’ between different locations, represented by H3 hexes. We report these co-occurrences in urban areas, using 50m hexes.
To ensure that the data is showing general trends, we ensure that any patterns which we only see once or twice are discounted, and that trips are being made by a minimum number of devices, removing those that aren’t.
We take a rigorous approach to privacy, so in addition to the above we have also made sure that only locations which have a relatively high level of interaction can be accessed, home locations are excluded, and we don’t report around sensitive points of interest.
What next?
As we’ve begun to use this data, we’ve found that the product can be really powerful as a supply side indicator when used in conjunction with our Small Area Footfall dataset, which can proxy demand. We are looking to improve the integration between the two in MAPP.
We’re also aware that this product works really well for pedestrians in urban areas, but the same questions remain for customers in vehicles, and across larger distances. We’re developing a cross-shopping product that will help to answer these questions, based on our popular Retail Places definitions.
We’d be delighted to give you a demo of our mobility products and talk to you about any specific needs you might have, please get in touch at info@geolytix.com.