Chris and I first worked on our encouragingly titled ‘Pub Project’ back in May, as we thought it would be interesting to see the impact of the lifting of restrictions in the UK – particularly on the food & beverage industry, one which has been harshly impacted.
Our first report determined that London was indeed ‘bouncing back’ (no doubt aided by us Brits not letting rain put us off our first pint!), with Yorkshire recovering rather well too. By the time our second round of analysis rolled around (this time analysing the impact of the opening of indoor seating), Boris Johnson and the UK Government announced that Freedom Day (originally June 21st) was a no-go. Delayed. All of those ‘June 21st outfits’, days booked off work (and generally a nationwide day of somewhat normality) was put on hold. And so was our Part 2.
But now we’re back, with a bigger set of mobility data which will help us determine how well London is doing, now Freedom Day has occurred. Using Unacast mobile ping data, we have looked at the movement of unique mobile devices around our food & beverage (f+b) hubs, across London, 4 weeks before and after Freedom Day, 19th July 2021.
Our f+b hubs were all created by us, making for a very unique data set. The hubs cover locally recognised ‘destination’ eating and drinking places across cities, large towns and tourist towns and were created by determining which are on the same or adjacent streets. We then pinpointed areas of a high concentration of these establishments. The final stage was a manual review, set to categorise the type of hub and whether it was predominantly eating, drinking or clubbing.
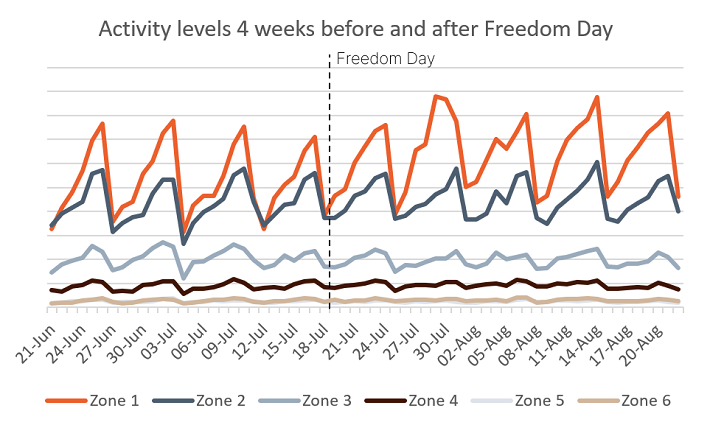
Graph 1 tells a story of mobility across all 6 London zones, highlighting particular zones that could be of particular analysis. It is encouraging to see that Zones 1 and 2 are experiencing an increase in activity levels, as through lockdown, Zone 1 (Central London in particular) experienced a significant drop in activity levels, as people weren’t travelling into London – due to the Stay at Home orders.
I would argue the weather certainly had a part to play in this – remember back to April 12thwhen a large swathe of the UK was hit with torrential rain? Whilst some avid ‘fans’ didn’t let the rain deter them (hiding under umbrellas nursing a much anticipated pint), I know for a fact I didn’t rush to dine outdoors. July however was a much warmer month, especially around Freedom Day when much on the UK faced a rare heatwave (with temperatures up to 30+ degrees) – ideal for staycations, and a trip out to the pub with friends.
Zone Analysis
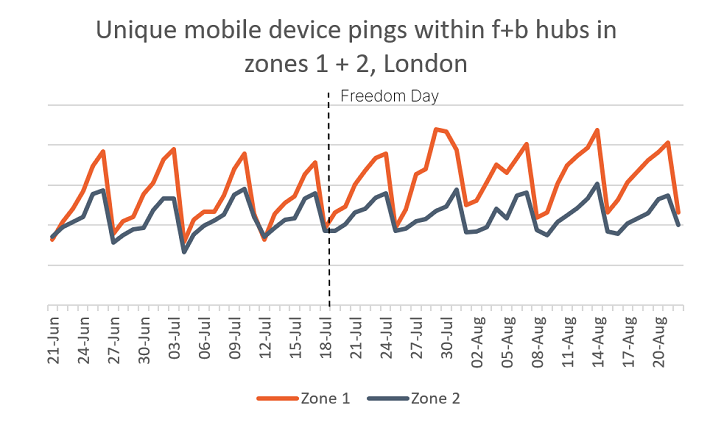
To prevent this report from being hundreds of pages long (believe me, we could write and write), we thought we would analyse both zones 1 and 2 and zones 3-6 together, as they have naturally grouped. Activity levels in Zone 1 have certainly ‘responded’ to Freedom Day, and whilst there are dips and troughs in the levels, these would be expected – we would expect Thursday-Saturday to be the busiest parts of the week, especially as friendship groups are reuniting, and nightclubs and bars are able to open; outside of the working week (Friday and Saturday evenings), is when people are likely to meet up and socialise. To note, these dips across the weeks fall on a Sunday (likely the days when people are nursing hangovers and not particularly wanting to leave their house).
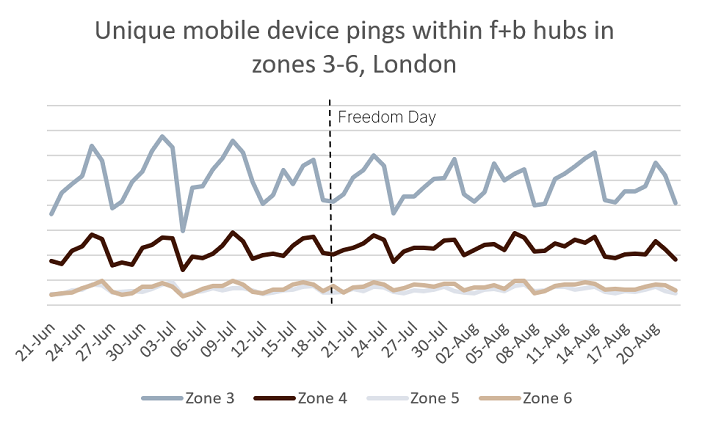
By isolating zones 3-6 in Graph 3, it becomes apparent, that whilst activity levels may not have increased dramatically after Freedom Day, activity levels haven’t been dipping as much now that restrictions have been near enough fully lifted. The most significant ‘dip’ in activity levels across all 4 of the zones in Graph 3, was experienced on July 4th, before Freedom Day.
The fact that we haven’t see a dramatic peak in activity levels shouldn’t be disconcerting though. Easily forgettable (especially with the lack of August heatwave we were promised), is that we are in the midst of summer holidays; the second half of August, leading towards ‘back to school’, often results in many people taking annual leave and getting away for a few days. That, matched with an increase in people moving out of London to more rural areas where houses (and gardens) are bigger – and in some cases more affordable – means that slightly muted activity levels after Freedom Day is not surprising. Perhaps our next in the series should focus on the commuter towns surrounding London, or areas that have seen the highest number of house sales?
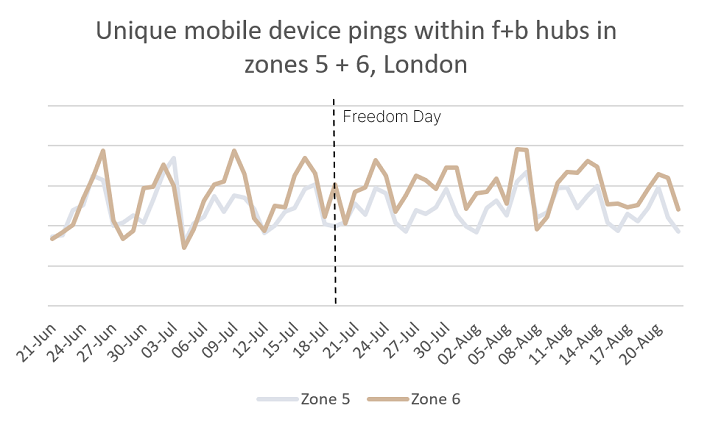
To give Zone 5 a little visibility (hidden under Zone 6 in Graphs 1-3), we have put in Graph 4 which does highlight how similar activity levels are in these two oyster zones. Following a very similar pattern of activity levels, the only major differentiation we can see between the two zones is that Zone 6 is experiencing slightly higher levels of activity. Catching up with a colleague of ours who lives in Waltham Forest, we discussed that perhaps Zone 6 is still experiencing this higher level of activity as people have (through Lockdown) moved to ‘the end of the tube line’. Residential areas in Zone 6 (borough analysis is further on in the report) offer slightly more space but are still accessible to central London.
Borough Analysis
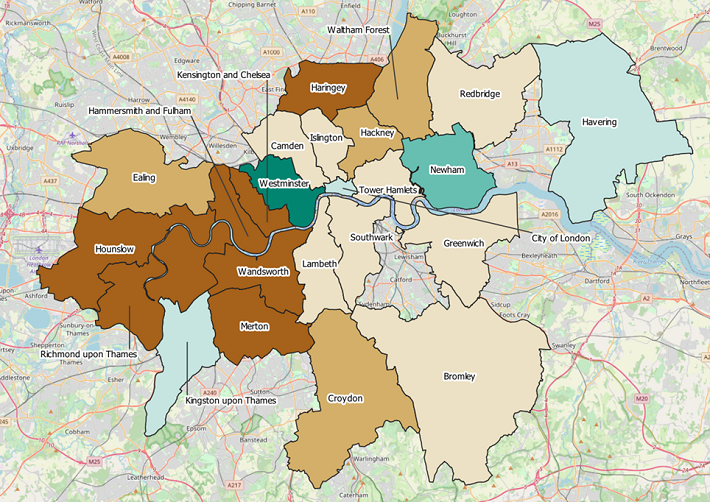
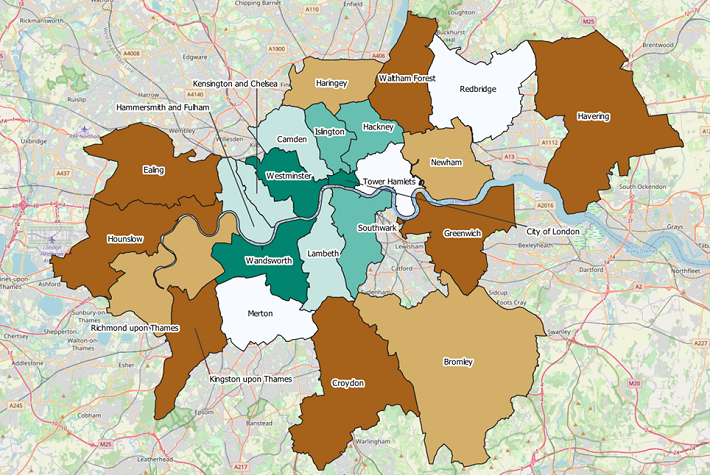
There is a definite geographical pattern to the change in activity levels after Freedom Day (July 19th). Westminster, Newham and Havering and City of London are boroughs to note, experiencing a 38%, 21%, 19% and 18% increase in activity levels respectively. It is interesting to note that 6 boroughs in London (all in West London – except Haringey) experienced a decrease in activity levels after Freedom Day. However, as theorised earlier, this could be for a number of factors, including people travelling into other areas of London (central London for instance), or out of the city for a staycation; it isn’t cause for concern, as the majority of London boroughs did experience an increase in activity levels.
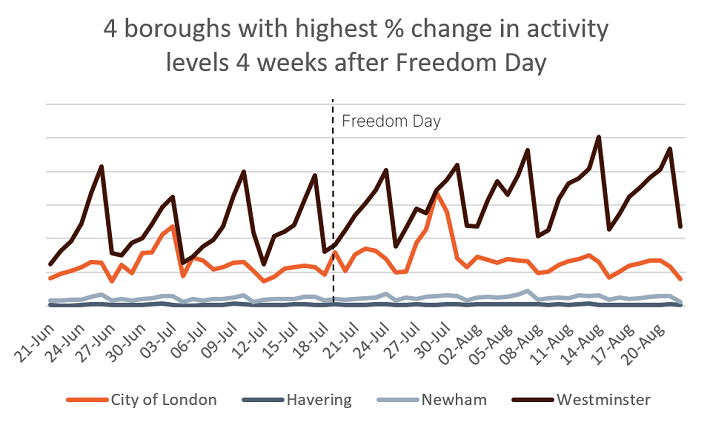
Take Graph 5 for instance, which highlights the 4 boroughs mentioned above. Westminster is experiencing a considerable increase in activity levels, which is extremely encouraging, as Westminster (and other central London boroughs) did suffer from a decrease in footfall during Lockdown. It is therefore great to see an increase in activity levels – people returning to central London.
It must be noted that Graph 5 isn’t representative of actual activity levels, but rather a % change. For instance, City of London, whilst only experiencing an 18% increase in activity levels (which was below Newham and Havering), did experience higher activity levels, than the two aforementioned boroughs.
If we were to look at activity levels (as opposed to the % change), there is a slightly different pattern that becomes apparent. Map 2 indicates that in fact, the central hub of London, including Hammersmith & Fulham, Islington, Hackney, Southwark and Tower Hamlets were experiencing high levels of activity. This is incredibly encouraging to see as it indicates people are journeying back into London, albeit it commuting into the office, or tourism.
Looking at the top 4 boroughs as by actual activity levels, shown in Graph 6, then we would see City of London and Westminster, alongside Hackney and Wandsworth.
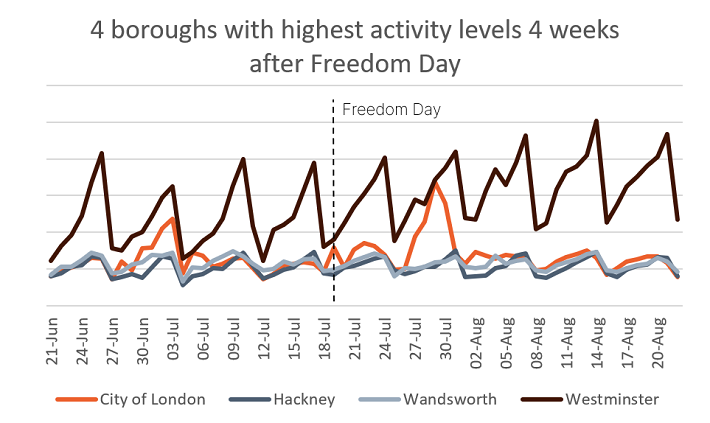
It is interesting to note that the City of London experienced similar activity levels as Hackney and Wandsworth, yet the weekend of 3rd July and 30thJuly did see two significant spikes in activity, with City of London experiencing activity levels closer to those in Westminster.
F+B Hub specifics
Our initial interest was looking at activity levels around food & beverage hubs in London, as this was an industry that was severely impacted by COVID and the multiple consequent lockdowns.
Seeing that there are boroughs that have experienced an increase in activity following Freedom Day, why not look at the areas of high activity within the boroughs themselves.
Westminster and City of London.
We analysed these two boroughs earlier in the report as they experienced both the highest % change in activity levels, and the highest activity levels, after Freedom Day.
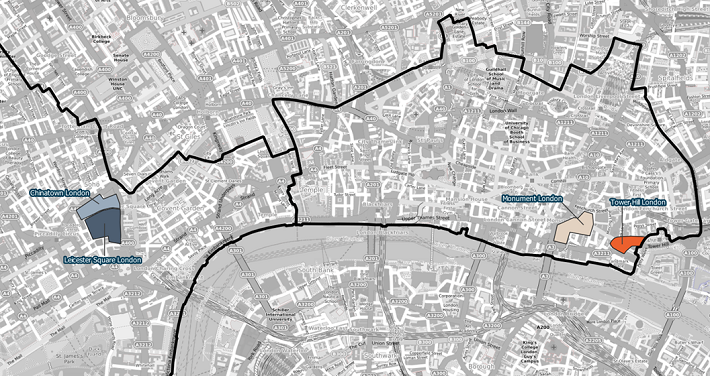
With almost 60 individual f+b hubs across Westminster and City of London, it was most beneficial to highlight those f+b hubs that experienced the highest activity levels; for Westminster this was Leicester Square (by a long shot) and China town – shown in Map 3.
It is interesting to note that these f+b hubs are located in close proximity to each other which does indicate that once in London people are possibly happy to walk around and explore the surrounding areas; if they are visiting Chinatown after a recommendation from TikTok, they may venture into Leicester Square for instance.
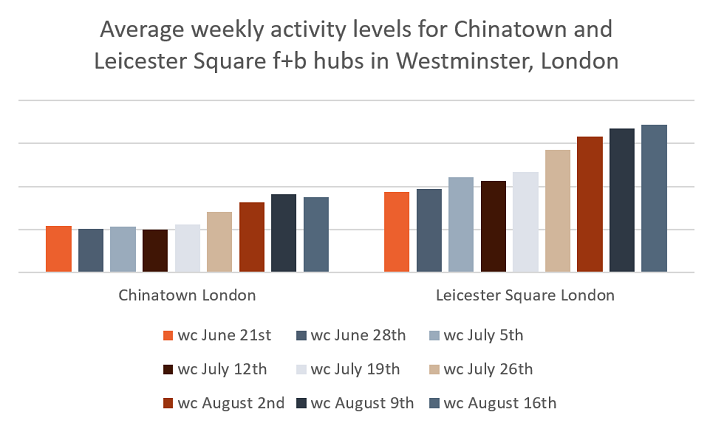
Graph 7 follows a pattern that was almost expected after Freedom Day – that activity levels in London would continue to increase, as people's confidence returns. These two F+B hubs are really the core of London's night time economy and we see that activity had flatlined until restrictions were eased, and since then levels have only grown as Londoners and tourists alike rediscover the restaurants, bars, clubs and theatres London has to offer. Night time economies had few ways to function under the previous restrictions, so their recovery only really begins now, and its hard to imagine the growth seen here will slow down soon.
Chinatown, like Leicester Square (and many other places in London) is a destination in its own right, however the increase popularity in social media platforms such as TikTok could be part of the reason why activity levels are increasing in this f+b hub. “Where to eat in London” type videos have shot up in popularity, particularly now Lockdown has lifted and people are desperate to get out of the house and explore the UK (either further afield or right on their doorstep). Food stops in Chinatown have been making the tops of the list, including Bunsik (for their Corndogs) or Hefaure, for their dreamy Japanese pancakes.
In City of London, it was Monument and Tower Hill f+b hubs that experienced the highest activity levels – shown in Map 3.
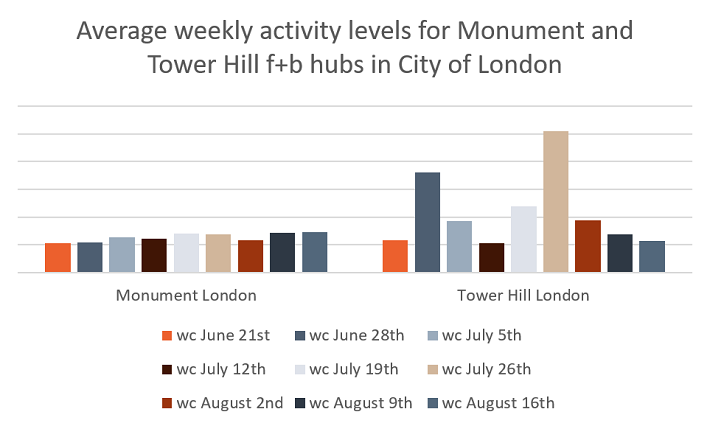
Unlike Graph 7, Graph 8 follows a pattern that wasn’t initially predicted; whilst Monument followed the pattern of (steady) increase through the 4 weeks before and after Freedom Day, Tower Hill has instead seen two major spikes in activity - weeks commencing June 28th and July 26th. Interesting to note, these were 3 weeks before and 1 week after Freedom Day (respectively).
With regards to Monument, the proximity to London Bridge as well as the plethora of restaurants and bars could have influenced the increase in activity levels. With restrictions lifting, and groups over 6 able to join together in venues, ordering at the bar a ‘pre-covid’ activity we can once again do, and nightclubs opening their doors and dancefloors, we expected that areas with bars and nightclubs to experience an increase in activity.
Wandsworth and Hackney.
The borough of Wandsworth and Hackney (alongside City of London and Westminster) saw the highest activity levels after Freedom Day.
As Wandsworth and Hackney have fewer f+b hubs that Westminster and Chinatown it was viable to present them all in Graphs 9 & 10.
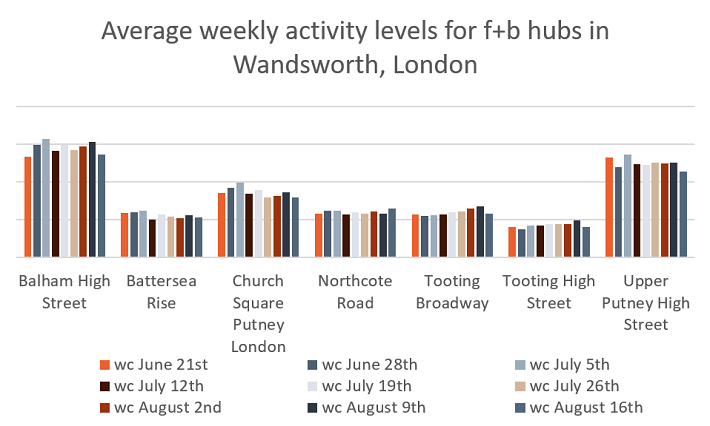
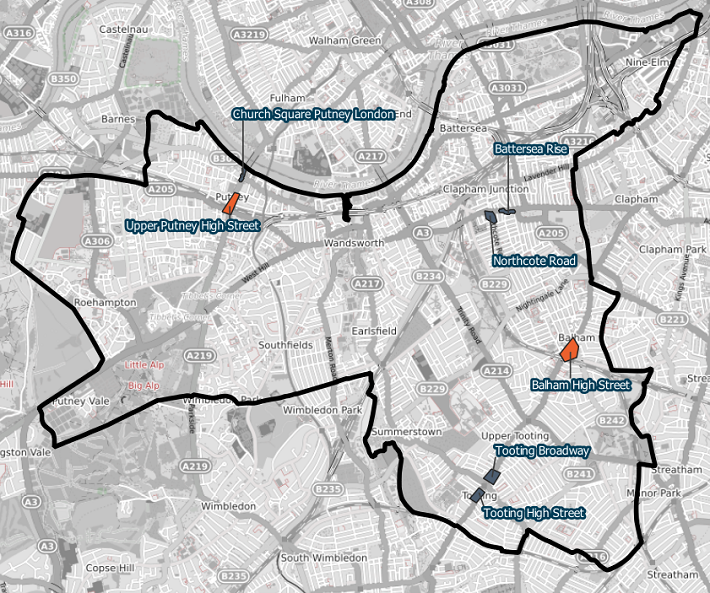
As is evident, Balham High Street and Upper Putney high street experienced the highest average weekly activity levels in Wandsworth. Looking at Map 4, it is interesting to note that these two f+b hubs aren’t necessarily in close proximity, with Upper Putney High Street in North West Wandsworth, and Balham high street closer to East. It could be argued that proximity results in an activity level through flow. Graph 9 indicates that Church Square Putney f+b hub was the third ‘busiest’ hub in Wandsworth, which is located near to Upper Putney High Street.
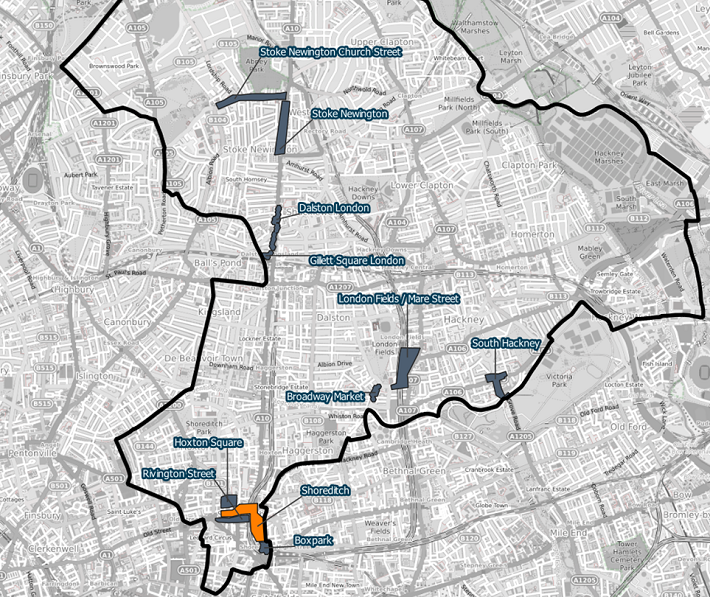
In Hackney (Graph 10 and Map 5) - as opposed to the other boroughs we have looked at - there is only one f+b hub that has experienced an extremely high average weekly activity; Shoreditch. Map 5 indicates the location of Shoreditch in comparison to other f+b hubs in Hackney and it is interesting to see that even though there is the close proximity to Horton Square, Rivington Street and Boxpark, only Boxpark f+b hub saw activity levels ‘stand out’ in Graph 10.
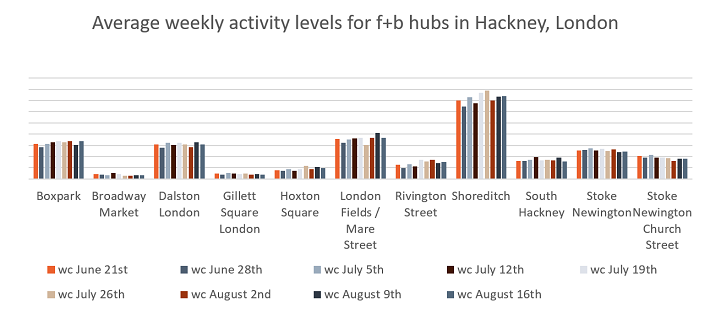
Akin to activity levels in Westminster, City of London and Wandsworth, again we see the pattern of high activity levels seeming to group around an activity ‘overflow’ – visitors to Shoreditch, may then find themselves walking into Boxpark.
A boost in average activity levels in Shoreditch is not overly surprising as the area is renowned for art, fashion and food; celebrating the opening of its third UK site in Leonards Street in Shoreditch, ‘EggSlut’ set up a food truck in Brick Lane on August 14th offering 100 free sandwiches.Whilst this was only a one day event, it would bring an increase in activity to Shoreditch (and surrounding areas) as people journey in to try the ‘edible breakfast clouds’.
So where does the weather, summer holidays and an app come into things?
You’ve no doubt read headlines in the news about highstreets footfall levels dropping below pre-covid levels. Whilst these are centred around high streets, and we are focussing on f+b hubs, it speaks about activity levels in public areas. The weather is often to blame, with headlines saying ‘turbulent weather’ from the incredible heatwave we saw in July to the thunderstorms and rain we’re experiencing now, deterring people from highstreets and f+b hubs - in a heatwave, first thought is to head to the beach or park, and not walk around shops or grabbing something to eat. Although I will admit I did head to the cinema to enjoy the aircon.
The same is to say for the pingdemic. The NHS track and trace app has been notifying people in the millions that they have potentially come in contact with covid and need to isolate. This ‘pingdemic’ has resulted in venues and shops having to close for periods of isolation as their staff are unable to work. Supermarkets are offering paid incentives for truck drivers to apply for jobs as a large majority of their driving force have been told to isolate; the same can be said for in-store workers, leaving shelves as empty as the start of the pandemic- remember the fight for toilet roll and pasta!
The secondary impact of the pingdemic is people are cautious to leave their homes in case they do get pinged – whether they have plans locally, or are venturing abroad for the first time in 18 months, a ping could leave them isolating and their plans scuppered. This is the case with the return to the office too, especially for those commuting into London. The fear of the ping is very real.
This is to say that whilst recovery seems to be on the up and up, I imagine activity levels could be higher if it weren’t for adverse weather and the NHS track and trace app. On the latter though, it is so crucial that we follow rules and regulations and recommendations to isolate, in order to keep the country up and running. Hopefully we are over the last of lockdowns, but as we’ve seen so far in the pandemic, you can never be too sure if there is another wave on the way.
Regardless, London has certainly continued its road of recovery, and we can see the impacts of restrictions lifting on Indoor Eating and Freedom Day. According to our Retail Recovery Index (RRI), developed bespoke in-house last week (wc 16thAugust), London was at 72% of pre-covid activity. To put into context, in Lockdown 2 in December, activity levels in London dropped to 15% of pre-covid levels. It is clear to say that overall London certainly is bouncing back. I imagine come September, more workers will return into the office, and business travel into the capital will continue to grow. And confidence will play a big factor also; coming into our second full month of no restrictions, and (hopefully) not returning into another lockdown, confidence will increase, and people may start travelling further from home. Plus, Christmas is only 4 months away – time to start that shopping!
Chris Storey & Kate McGoldrick, Data Scientist and Communications Officer at Geolytix