
Geolytix Small Area Footfall has quickly established itself as one of our most popular UK datasets. Used and loved by clients and modellers alike who find immense benefit in using the power of mobility data to show which areas of Retail Places are busy (or not!) when making site decisions.
One of the most loved things about our dataset is its resolution. Reported in 20m hexes, we provide one of the most granular footfall breakdowns available in the UK market.
Our latest update, released earlier this month, is available in over 20,000 Retail Places across the UK, a 25% increase on previous releases.
Building confidence in our approach
At Geolytix we are in the privileged position of being a consultancy with the freedom to choose the right data source for the project or product at hand. This freedom of choice and breadth of access to different data sources allows us to understand the relative strengths and weaknesses of each of the datasets we use.
On top of this, having spent years working with mobility data from multiple different suppliers, and experimenting with its capabilities, we’re very clear on what we will confidently report in products derived from SDK driven mobility data (for more detail, see this post, which is still wonderfully relevant!), and what we won’t.
For example, one frequent request is to see the footfall count for a very specific time period (weekday evenings, for example). We find that by cutting the data multiple ways, any sample becomes too small to report with any real certainty. As a result, while we confidently report annual average footfall counts, we will use indexes to report different time periods (weekday vs weekend, or ‘daypart’ - a grouping of hours of the day).
Another example of a common question is whether mobility data can be used to track change over time. Unfortunately, we find the nature of SDK mobility data feeds too volatile to report temporal changes. The approach requires a large amount of external ‘stabilising’ data (which we used for our now discontinued ‘Footfall Tracker’ product) to help tell the real story of change. For these change based questions we now prefer to use banking data, which while still not perfect, has proven to be inherently more stable over time.
Continuous improvement
Bringing these insights to life, taking our experience, along with feedback from clients and our own teams (who use the data for modelling and analysis projects themselves), we’ve landed what we consider to be some major improvements.
Improved resolution
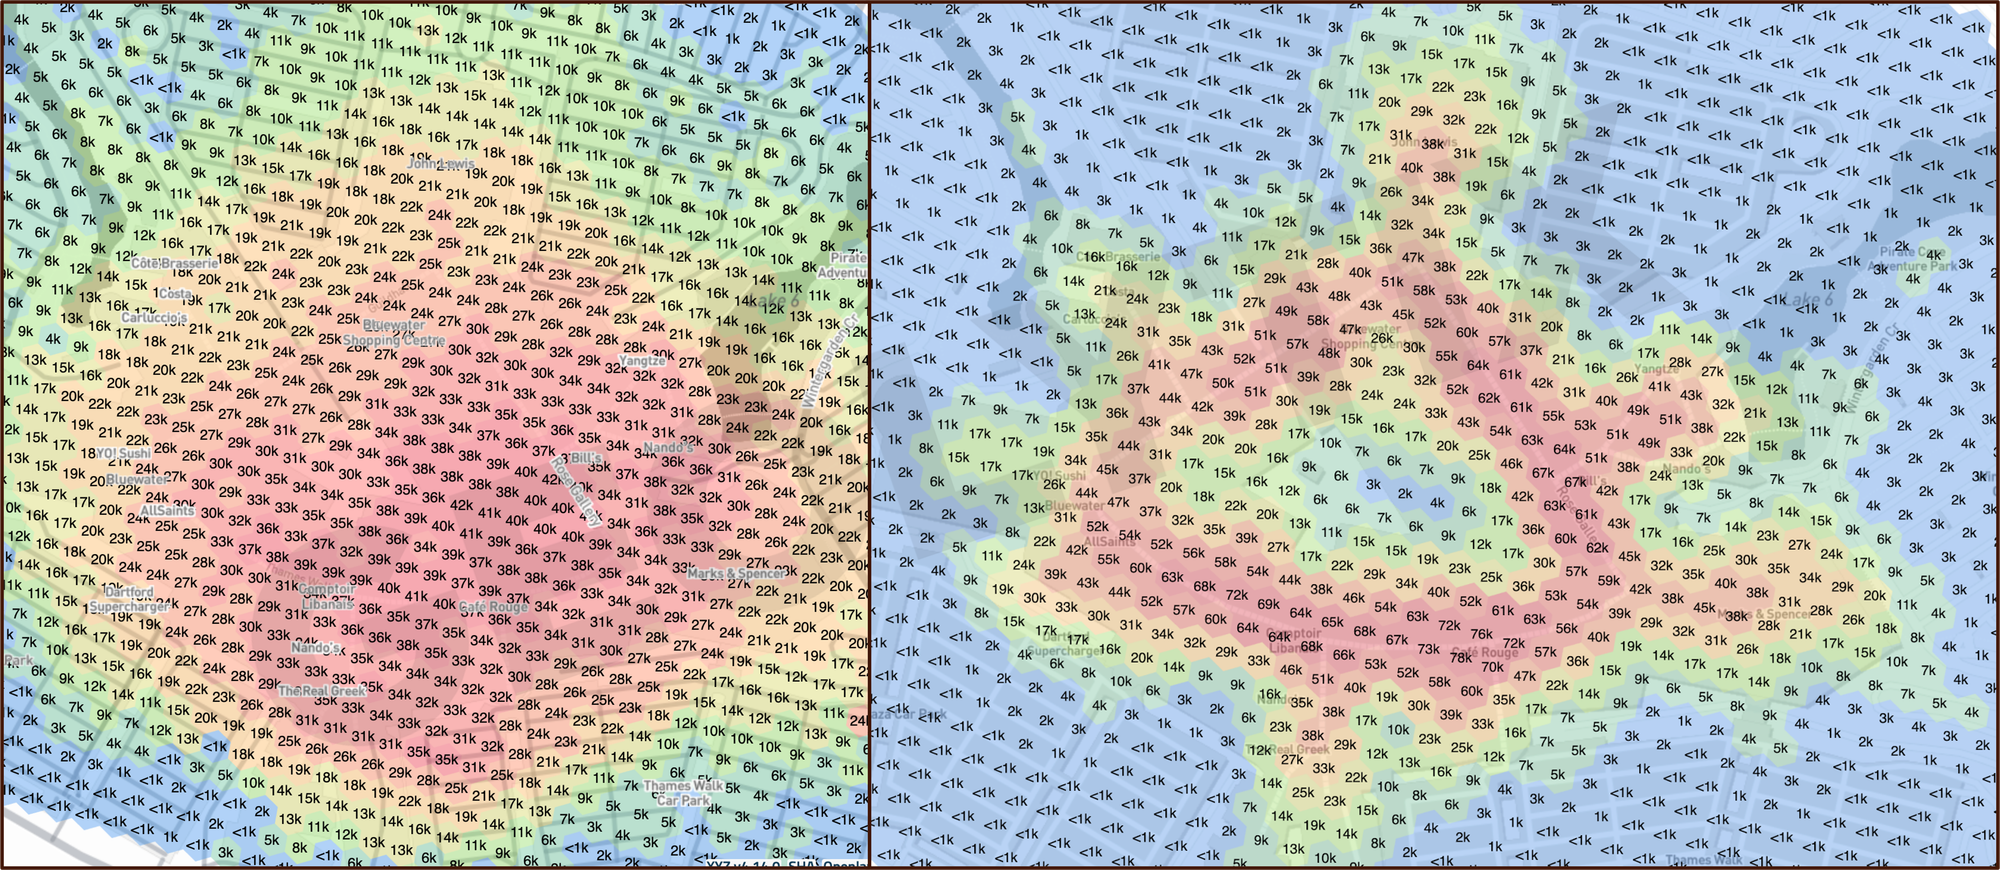
Part of the process of creating a footfall product is to smooth the raw data. Mobile phones don’t ‘ping’ all the time, but the people carrying them cannot teleport from one place to another. We use smoothing techniques to interpolate movement between different hexes. We’ve improved this logic to render Retail Places in sharper relief than in previous years, allowing our user to pinpoint more clearly the busiest spots.
New ‘Unique Visitor’ metric
We have created a new measure that shows the number of unique visitors per day in a given Retail Place. We expect that this will allow both us and our clients to rank the relative busyness of different retail places, allowing them to prioritise targets for new store expansion.
More sources of ground truthing
We have incorporated more ground truthed footfall counts than ever before. From publicly available information sources, through to commissioned surveys, and even our own team carrying out targeted counts, we’ve left no stone unturned to ensure we’re reporting sensible numbers.
…and always room for more!
We never shy away from describing our footfall product as a modelled result. Irrespective of your data source, any nationally available product will always rely on modelling to scale the sampled data to general coverage. As with any model, there can always be improvements. We’ve already got some ideas ahead of next years update!
Have a look for yourself
If you have any feedback on our footfall product, or would like a demonstration, then please get in touch at info@geolytix.com.


